July 8th, 2026
Improved
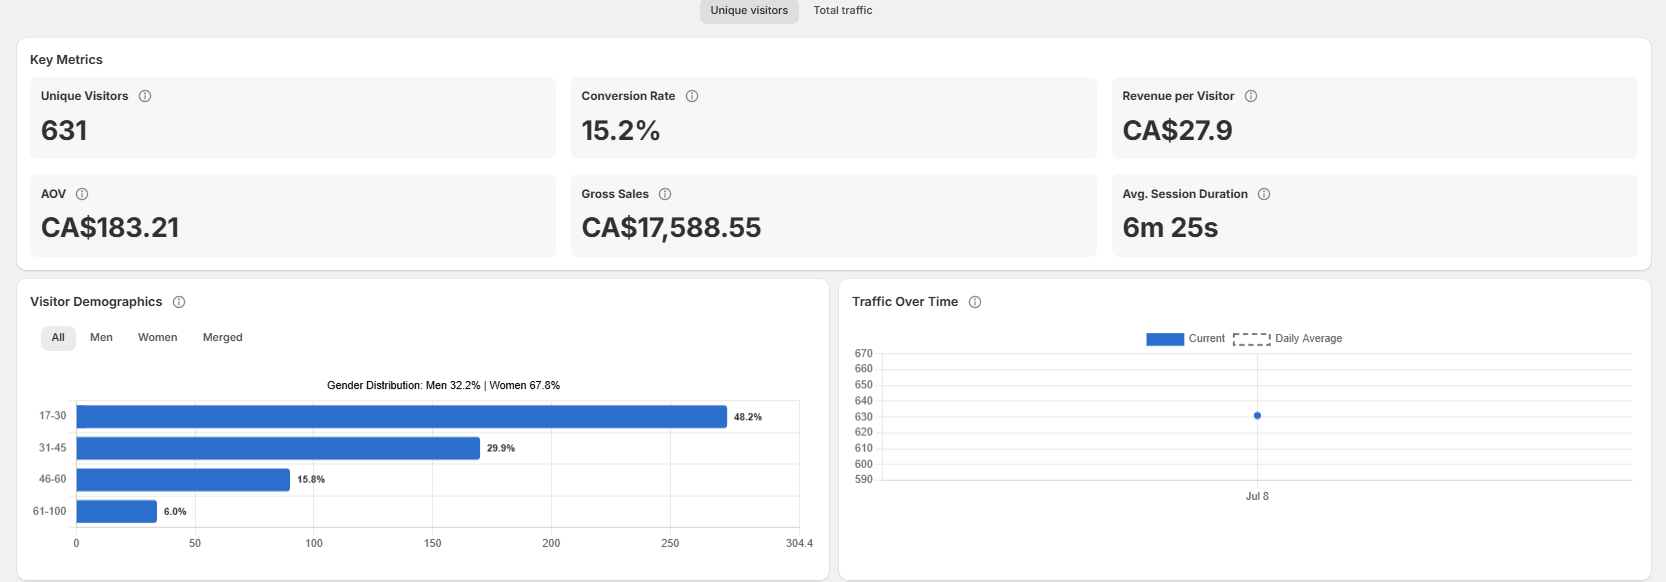
Clearer traffic and conversion metrics
We’ve improved the way Avia explains key dashboard metrics, including Total Traffic, Unique Visitors, Conversion Rate, and Average Session Duration.
These updates make it easier to understand what each metric means and why some numbers may be different from others.
What changed
Added clearer explanations for Total Traffic and Unique Visitors
Clarified that Total Traffic counts each visit or entry event
Clarified that Unique Visitors counts the same person once during the selected date range
Improved the explanation of Conversion Rate
Added clearer guidance for dashboard date ranges and filters
Why it matters
Traffic and conversion metrics are important for understanding store performance.
These improvements help users read the dashboard more confidently and reduce confusion when Total Traffic and Unique Visitors do not match.
Who is affected
All users reviewing Avia dashboard metrics.
How to use it
Open the Avia dashboard, select the store and date range, then review the traffic and conversion metrics.
If the numbers look different from what you expected, check whether you are viewing Total Traffic or Unique Visitors.
Learn more
Read these Help Center articles:
Dashboard overview
Footfall & traffic metrics explained
Conversion rate & dwell time
Using Date Ranges & Filters